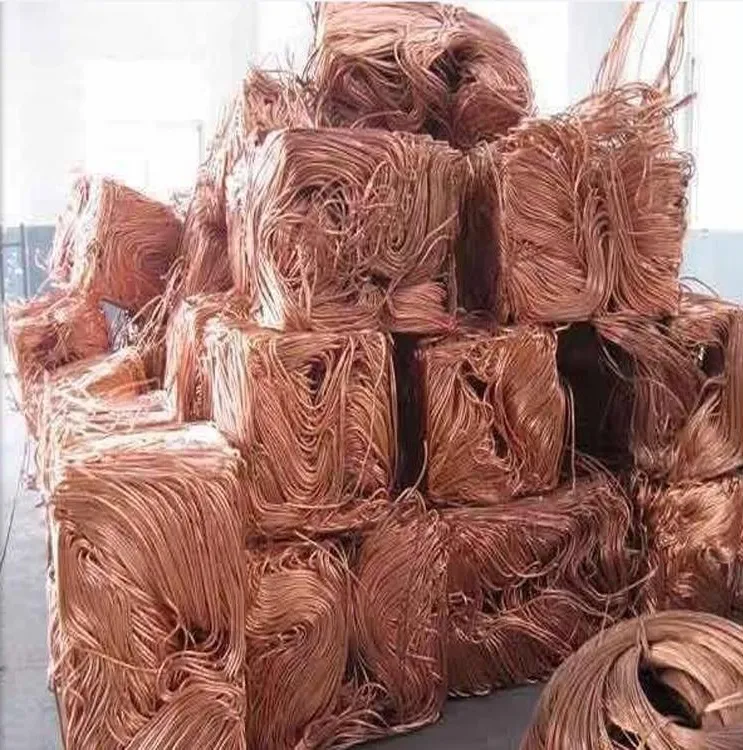
Scrap Copper Wire Prices Chart: Tracking Value in the Recycling Market
Scrap copper wire prices chart is an essential tool for anyone involved in buying or selling copper scrap. Whether you are a small-scale collector, a contractor with leftover wiring, or a large recycling business, understanding how copper wire prices change over time can significantly impact your profits. Fortunately, these charts provide a clear and convenient way to monitor fluctuations, helping users make smarter financial decisions.
What Is a Scrap Copper Wire Prices Chart?
A scrap copper wire prices chart is a graphical tool that displays the historical and current prices of various types of copper wire scrap. Typically updated daily or weekly, these charts are available through metal trading platforms, scrap yard websites, and industry news sources.
In most cases, these charts include data for multiple wire grades, such as:
- Bare Bright Copper Wire
- #1 Copper Wire
- #2 Copper Wire
- Insulated Copper Wire
Because of this comprehensive breakdown, users can easily compare rates across different types of scrap and determine the best time to sell or purchase.
Why Prices Fluctuate
The scrap copper wire prices chart reflects changes driven by several influential factors. Below are some of the key reasons why prices often rise or fall.
1. Global Copper Market Trends
First and foremost, global demand plays a major role. Since copper is traded worldwide, any increase in demand from industrial giants like China or India can push prices up quickly. Conversely, a slowdown in economic activity may lead to price drops.
2. Economic Conditions
In addition, macroeconomic factors such as inflation, interest rates, and employment rates can influence copper demand. For example, during times of economic growth, construction and manufacturing typically increase, which in turn boosts copper prices.
3. Supply and Recycling Rates
Moreover, supply levels have a direct impact on pricing. When recycling facilities generate an abundance of copper scrap, market saturation may occur, causing rates to fall. On the other hand, when supply becomes scarce, prices often surge.
4. Energy and Transportation Costs
Furthermore, the cost of recycling depends heavily on energy and transportation expenses. If fuel or electricity prices rise, these costs are usually passed on to buyers, thereby influencing scrap wire prices reflected in the chart.
How to Use the Chart Effectively
To make the most of a scrap copper wire prices chart, consider the following strategies:
- Monitor Trends: Regularly observing price movements can help you recognize patterns and forecast short-term fluctuations. As a result, you’ll be better positioned to decide when to sell.
- Compare Grades: Charts often display values for multiple wire types. Therefore, comparing these rates allows sellers to prioritize higher-paying grades like bare bright.
- Time Your Sale: If you notice a consistent upward trend, holding your scrap for a few extra days could lead to a higher payout.
- Stay Updated: Additionally, subscribing to market alerts or using apps that track copper prices in real time ensures you never miss a pricing opportunity.
Conclusion
In conclusion, a scrap copper wire prices chart is a powerful resource for anyone in the metal recycling industry. Not only does it offer a snapshot of current market values, but it also helps users understand broader pricing trends. By leveraging this information—and by timing your sales wisely—you can improve profits, reduce losses, and stay competitive in an ever-changing market.

